December 9, 2025
Nov 2025 eGrocery Sales Total $12.3 Billion: The shift from “convenience” to “preference”
No items found.

Search by topic
For retailers analyzing eGrocery performance, the latest data from Brick Meets Click and Mercatus provides a clear message: online grocery is no longer just a secondary option for U.S. households—it is rapidly becoming the primary method of procurement for high-value shoppers.
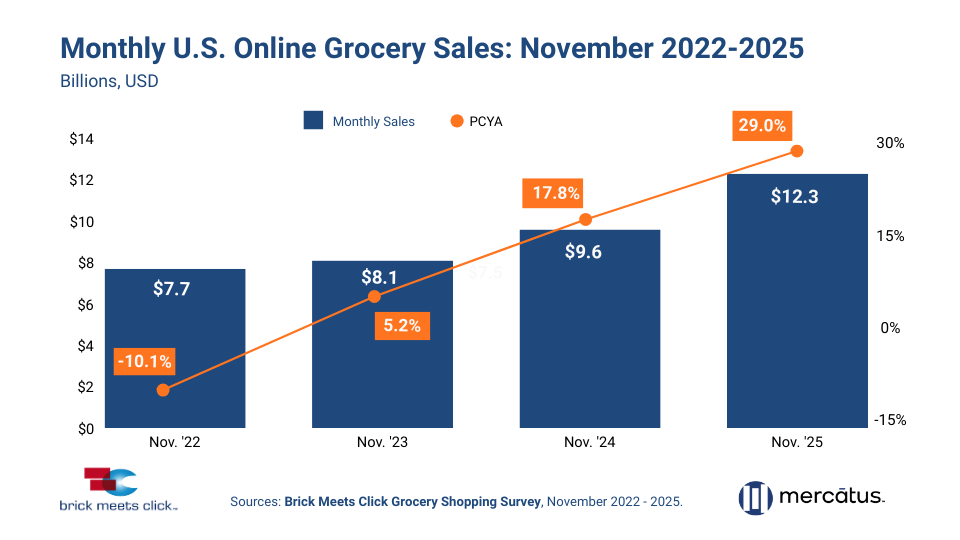
- Total U.S. online grocery sales surged 29% year over year (YOY) to $12.3 billion.
- Following a moderate October impacted by the government shutdown, November 2025 delivered a strong YOY rebound in performance as eGrocery sales have accelerated each November since 2022.
However, the overall monthly sales results are secondary to the underlying behavioral shifts. The data indicates that eGrocery growth is now being fueled by structural changes in shopper habits rather than simple user acquisition.
Here are the three critical takeaways for retail leadership.
1. Frequency is helping to drive the topline
The 29% sales jump wasn't solely the result of new eGrocery customers; it was driven by existing Monthly Active Users (MAUs) shopping more often.
- 15 Months of Growth: Order frequency among MAUs climbed YOY for the 15th consecutive month, rising 12% to an average of 2.8 orders per month.
- The Rise of the "Super User": A record number of users placed three or more orders during the month, with nearly half of all MAUs now falling into this high-frequency segment.
- Core Demographic Lock-in: The 30–44-year-old demographic—the core shopping group for eGrocery—saw frequency surge over 20%, completing an average of 3.1 orders in November.
2. Share of Wallet is Migrating Online
Online share of total weekly grocery spending jumped 340 basis points YOY to finish November at 17.1%. The online share expansion was fueled largely by higher spending rates in Large Metro markets, by the 30-44 age group, and by households earning $100K or more annually.
While the top-line Average Order Value (AOV) climbed 11%, the competitive landscape is shifting between formats and delivery methods. Mass merchants reported stronger spending gains than Supermarkets when looking at combined Delivery and Pickup orders.
- Ship-to-Home: Posted the strongest YOY AOV gains (+12%), largely driven by Amazon’s expansion of same-day fresh grocery services.
- Pickup: Remains solid with AOV up 11% vs. year ago.
- Delivery: Saw an AOV lift of 8% YOY.
3. The Omnichannel Shopper is Diversifying
Grocery shoppers are no longer staying in a single fulfillment "lane."
- The share of MAUs utilizing only one receiving method dropped to historic lows in November.
- Conversely, the share of shoppers using some combination of Delivery, Pickup, and/or Ship-to-Home rose rapidly.
Because shoppers are using multiple methods, individual method MAU bases saw double-digit gains even though the total user base only grew in the mid-single digits for the month.
The Bottom Line
David Bishop, Partner at Brick Meets Click, summarizes the current environment best: "eGrocery is evolving from just a convenient option to the preferred way to get groceries for many".
As we head into 2026, these insights suggest that winning grocery retailers will be those who can defend against Mass formats by having a strong value proposition that is designed to drive loyalty and offer their customers great service.


Insight-driven advocacy for Grocery
retail success.


© 2026 Brick Meets Click - all rights reserved - unauthorized use prohibited.