
September 22, 2026
August 2026: eGrocery sales up nearly 25% year-over-year
No items found.

Search by topic
Top-line: Online grocery shopping momentum continues to pick up steam as monthly sales jumped by almost 25% versus last year according to the Brick Meets Click Grocery Shopping Survey fielded August 29 – 31, 2026.
More households bought groceries online and received orders using multiple methods in Aug. ’26 than in ’25. Order frequency had impressive gains year-over-year (YOY) and average order value was flat on a nominal sales basis due to several factors.
Meanwhile, overall grocery spending, which includes both in-store and online, rose just 0.7% YOY during Aug. ’26. When excluding online, in-store sales fell 4.1% based on estimates derived from the August 2026 Brick Meets Click Grocery Shopping Survey.
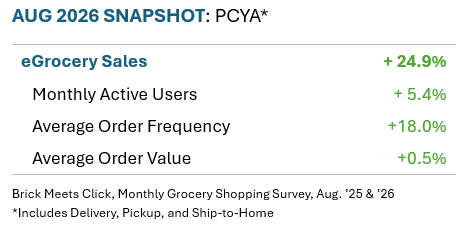
August 2026 Snapshot: Higher average order frequency rates power sales growth.
Monthly active users (MAUs) increased by 5.4% in Aug. ’26 versus a year ago.
- Sixty percent of all U.S. households bought groceries online during the month, whether that was for a single item or a basket of products, up over two points from a year ago.
- Delivery recorded the strongest YOY MAU base gains of the three receiving methods on a percent basis. The relative gains in Delivery’s MAU base were more than twice as large as Ship-to-Home’s, while Pickup’s MAU base contracted compared to Aug. ’25.
- The total pool of customers who have ever bought groceries online climbed to nearly 81% of all U.S. households in Aug. ’26, up slightly more than two percentage points versus last year. On a household basis, the total MAU base grew 4.0% YOY, revealing that most of the Aug. ’26 MAU growth came from true first-timers to online shopping.
Average order frequency (AOF) jumped 18.0% YOY as the pace of ordering.
- The relative (or percent) gains in AOF more than doubled versus last year’s growth rate and the overall growth trend in ’26 has steadily accelerated.
- Aug. ’26 marked the 24th consecutive month of YOY gains in this metric.
- Delivery drove approximately three-quarters of overall AOF growth in Aug. ’26. Ship-to-Home accounted for the remainder while Pickup saw a dip in the number of orders completed by MAUs.
Average order value (AOV) remained relatively unchanged, up <1% compared to ’25.
- Ship-to-Home’s strong order volume growth has created headwinds for the top-line AOV because Ship-to-Home AOVs are considerably lower than for Delivery or Pickup. However, spending per Ship-to-Home order continues to grow, increasing more than 10% YOY in Aug. ’26.
- Strong growth in fast Delivery order cycle times also dragged on top-line AOV growth as these are often smaller-sized orders. For example, an analysis of June ’26 results found that AOV of Supermarket Delivery orders received in three hours or less was about 30% lower compared to slower delivery orders. (see LinkedIn post)
Cross-shopping: Grocery MAUs are increasingly also buying from Walmart and Amazon
- In Aug. ’20, after the initial surge from the pandemic, nearly 15% of Grocery MAUs (including Supermarkets or Hard Discounters) also received an order from Walmart during the same month, and 11% of Grocery MAUs received an order from Amazon’s pure-play services, i.e., Subscribe & Save, Prime Pantry, and its marketplace.
- In Aug. ’26, those cross-shopping rates are significantly higher: 28% of the Grocery MAUs also bought from Walmart in the same month, and 19% bought from Amazon’s pure-play services that increasingly includes same-day and sub-3-hour fresh groceries via its Ship-to-Home operations.
This growth in cross-shopping rates underscores the importance of understanding how customer experience may vary across retailers and fulfillment methods, and how these differences affect the choices that customers are making.



Insight-driven advocacy for Grocery
retail success.


© 2026 Brick Meets Click - all rights reserved - unauthorized use prohibited.